ABS (acrylonitrile-butadiene-styrene), a terpolymer offering one of the most balanced combinations of rigidity, impact strength and chemical resistance among styrenic resins, is a primary raw material for appliance housings, consumer-electronics parts, automotive interior and exterior components, and everyday goods. In 2026, the ABS market has shown an unusual duality: on the supply side, it remains under the overcapacity pressure released by the expansion wave that began in China in 2021, while demand lacks aggregate growth. At the same time, geopolitical tensions in the Middle East and crude-oil volatility produced several sharp up-and-down swings during the year, capped by a cost-driven rebound in August–September.
This article reviews the operating logic of the 2026 ABS resin market through price action, cost structure, supply, demand, price spreads and outlook, and offers neutral reference points for international procurement decisions. It is not investment or procurement advice. Market figures cited reflect public snapshots as of 7 September 2026.
2026 Price Action: From Geopolitical Premiums to a Cost-Driven Rebound
| Period | Price action and market context |
|---|---|
| H1 2026 | Weak feedstock costs and subdued demand pushed prices down; in June, both cost support and consumption were soft |
| March 2026 | Escalation in the Middle East and rising shipping risk in the Strait of Hormuz sent crude oil and naphtha sharply higher, lifting chemicals across the board; leading Chinese compounders (e.g., Kingfa) announced price increases, and spot hubs such as Dongguan briefly saw panic buying and logistics congestion |
| April 2026 | The geopolitical premium unwound quickly; with costs and consumption both weak, ABS prices continued to fall |
| July 2026 | Downstream restocking triggered a rebound; feedstock prices firmed but demand stayed soft, and prices consolidated after the initial gain |
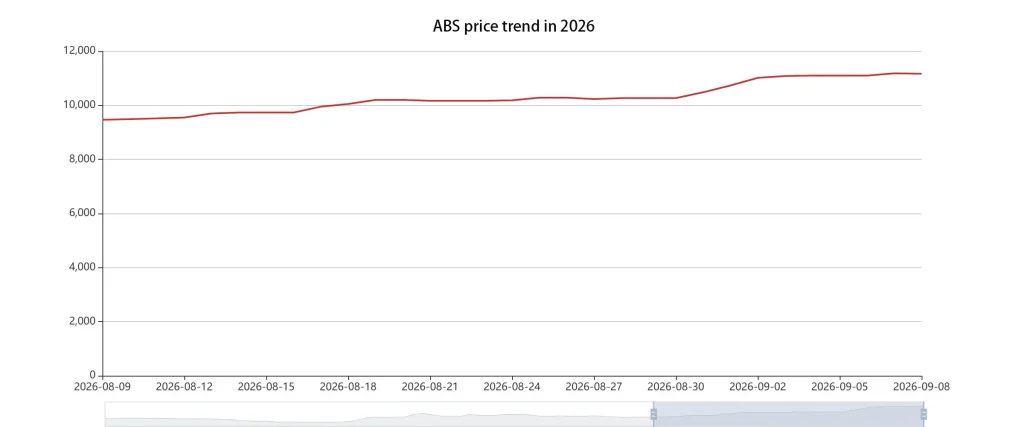
| August 2026 | The market turned from range-bound to clearly rising: the main reference price climbed from CNY 9,617/tonne on 1 August to CNY 10,483/tonne on 31 August (+9.0%) |
| Early September 2026 | Gains extended — the reference price reached CNY 11,183/tonne on 7 September (+4.2% versus 1 September). On 4 September, crude oil jumped about 11% in a single day and producers including BASF and Wanhua announced September increases of roughly CNY 1,000/tonne; spot prices traded mixed with firm cost support, and the market assessment shifted to “ranging” |
| Overseas markets, for comparison (August) | The earlier “Middle East conflict” premium faded; polypropylene softened while polystyrene rose on higher styrene costs; recycled-material demand was weak |
Key takeaway: The August–September rebound was fundamentally cost-driven — firmer upstream monomers following crude oil and supply disruptions — rather than demand-led. Market assessments moved from “clearly rising” in mid-August to “ranging” by early September, with spot prices trading mixed. Buyers should distinguish a cost-event rebound from a supply–demand-driven reversal: the former tends to be short-lived and carries greater chasing risk.
Cost Structure: Three Monomers and the Transmission Mechanism
ABS is produced from three monomers: styrene (SM; ethylene + benzene), acrylonitrile (AN; ammoxidation of propylene) and butadiene (BD; extracted from C4 streams). Industry consensus holds that styrene carries the highest weight in the cost structure and acts as the leading price variable for ABS. The widely cited explanation for compressed ABS profitability since 2024 is that “overcapacity has eroded spread value, while rigid styrene costs leave ABS little buffer.” Two market observations support this view: first, in August, overseas polystyrene rose on higher styrene costs while polypropylene — exposed to the same crude-oil move — softened, confirming styrene as the common cost axis for styrenic-chain products; second, both ABS rebounds in July–September were triggered by stronger feedstock costs rather than by demand.
China’s ABS cost structure has a regional character: self-sufficiency for the three monomers exceeds 80%, and integrated producers such as Zhejiang Petrochemical cover nearly all of their styrene, acrylonitrile and butadiene requirements internally. The cost floor of Chinese capacity is therefore set more by “feedstock self-sufficiency + scale” than by direct transmission of international crude prices. The corollary is that when styrene strengthens because of turnarounds or crude-oil spikes, non-integrated plants buying monomers on the open market feel the pressure first and typically trim run rates — which, in turn, tightens spot availability.
Supply Side: China’s Expansion Cycle Alongside Overseas Capacity Retreat
Chinese capacity doubled in five years while utilization collapsed (annual statistics):
| Indicator (China) | 2020 | 2024 | Change |
|---|---|---|---|
| Capacity (million tonnes) | 4.27 | 8.90 | ~20.2% CAGR over five years |
| Output (million tonnes) | 4.20 | 6.02 | ~9.5% CAGR |
| Apparent consumption (million tonnes) | 6.16 | 6.82 | ~2.6% CAGR |
| Capacity utilization | ~100% | 67.7% | -30.7 percentage points |
| Imports (million tonnes) | 2.02 | 1.02 | ~-15.7% CAGR |
| Exports (thousand tonnes) | 49.4 | 217.2 | ~44.8% CAGR |
Key structural facts: as of end-2024, Zhejiang Petrochemical (1.0 million tonnes/year), LG Yongxing (930,000 t/yr), Zhenjiang Chi Mei (850,000 t/yr) and Ningbo Taita (750,000 t/yr) led the ranking; the top ten producers together exceeded 6 million tonnes, or 78.25% of national capacity. Approximately 2.3 million tonnes of new capacity were expected to come on stream during 2025. With utilization at about two-thirds, general-purpose ABS has entered a textbook buyer’s market.
The trade picture changed just as dramatically: import dependence fell from 32.7% to 14.9% as mainland Chinese material displaced Taiwanese and Korean supply, while exports jumped from 49,400 to 217,200 tonnes. Vietnam (9,300 → 90,100 tonnes), Thailand (5,700 → 26,900 tonnes) and Indonesia (1,100 → 14,500 tonnes) were the core growth destinations, making Southeast Asia the primary outlet for China’s ABS exports.
Internationally, signs of overseas capacity retreat are emerging — for example, INEOS’s move to close its Ohio (US) site, the details of which should be confirmed against company announcements. Southeast Asia’s own capacity remains limited and heavily import-dependent, mirroring the growth in Chinese export volumes. For international buyers, the implication of this supply landscape is: sourcing options for general-purpose grades are broadening (mainland China as the primary source, Taiwan/Korea for high-end grades), and the balance of negotiating power has shifted from “securing supply” toward “grade matching and batch-to-batch consistency.”
Demand Side: A Mature Total Market with Structural Differentiation
In 2024, electrical and electronic appliances accounted for 63% of Chinese ABS consumption (with home appliances the largest segment), followed by light industry (13%), automotive (9%), office equipment (8%) and building materials (7%). Apparent consumption grew at only about 2.6% CAGR between 2020 and 2024, confirming that ABS demand has entered a mature phase in which growth comes mainly from structural upgrades:
- Home appliances: Trade-in subsidy schemes gave a visible boost to housings for air conditioners, refrigerators and similar products in 2024–2025, but total growth has come under pressure as subsidies were phased down. Smart appliances (display-equipped refrigerators, smart air conditioners) are creating structural demand for high-gloss, anti-fingerprint ABS grades.
- Consumer electronics: Smartphone housings and similar applications continue to migrate toward PC/ABS alloy, compressing the space for unfilled ABS.
- Automotive: The penetration of new-energy vehicles and strong vehicle exports are driving modified-grade demand for interior and exterior parts (low-odor, weather-resistant grades), while lightweighting trends favor modified ABS over some conventional materials.
- By region: Slowing growth in China’s domestic demand, combined with manufacturing relocation to Southeast and South Asia, is shifting the demand center of gravity outward — consistent with the surge in Chinese ABS exports. Manufacturing demand in Europe and North America has been soft, with spot prices there giving back geopolitical premiums in August.
Price System: Methodology Spreads, Grade Premiums and Substitution
ABS quotes for the same day differ across methodologies and must be read carefully (China market, early September 2026):
- On 7 September, two mainstream monitoring methodologies reported CNY 11,183/tonne and CNY 11,559/tonne respectively; on 4 September, another aggregated quote stood at CNY 10,500/tonne. Differences of 5–10% are common and stem mainly from sample grades, regions and statistical methods. Mainstream general-purpose ABS in China traded in the range of roughly CNY 10,500–11,600/tonne.
- Grade differentiation is far larger than methodology spread: an injection-molding grade in Shanghai was quoted at about CNY 12,300/tonne, while a flame-retardant grade (Chi Mei POLYLAC® PA-765A) in Jiangsu was quoted at CNY 32,300/tonne — about three times the general-purpose benchmark (grade properties should be verified against the manufacturer’s official documentation).
International buyers should specify the pricing basis (CFR versus FOB) and the exact grade when requesting quotes, and should not anchor contracts to any single platform price; cross-checking several market indexes and supplier quotes is recommended practice.
Grade premiums are the most notable price structure of 2026: general-purpose grades compete near the cost line, while flame-retardant, transparent, heat-resistant and plating grades hold meaningful premiums — transparent ABS has been cited with a premium of about CNY 4,000/tonne over general-purpose material and gross margins near 25%, and weather-resistant ASA with a premium of about CNY 1,800/tonne (2025 industry analysis basis). The early-September quote of roughly three times the general-purpose price for a flame-retardant grade is a direct illustration of this structure.
Substitution relationships: HIPS competes for mid- and low-end applications on lower cost; PC/ABS alloy substitutes for unfilled ABS in premium electronics; AS (SAN) coexists with ABS in transparent, rigid parts (for a head-to-head comparison of SAN, ABS and PMMA on properties and cost, see our dedicated analysis). The relative price of substitutes sets the “ceiling” for ABS price increases — when ABS trades significantly above HIPS or polystyrene on a cost push, downstream processors have an incentive to switch formulations.
Outlook for 2027: Scenarios and Leading Indicators
Rather than point forecasts, three scenarios with their triggers are outlined below, based on the mechanisms discussed above:
| Scenario | Core assumptions | Triggers / indicators to watch |
|---|---|---|
| Base case | Capacity utilization stays low; prices fluctuate with cost events; general-purpose spreads hug the cost line | Utilization at 65–75%; styrene price range; inventory cycles |
| Upside | Crude/styrene strengthen again (geopolitics or turnaround coincidence) and losses force deferral of new capacity | Middle East situation; styrene turnaround schedules; announcements of 2026–27 project delays |
| Downside | Oil retreats; new capacity starts on time or early; appliance exports weaken | Crude/naphtha prices; monthly Chinese ABS output and export data; appliance production schedules |
Leading indicators worth monitoring: styrene prices; ABS industry utilization and social inventories; China’s monthly export volumes (especially toward Vietnam, Thailand and Indonesia); CFR spreads into Southeast Asia and South Asia; and the evolving scope of carbon-related trade policies such as the EU Carbon Border Adjustment Mechanism, along with US trade-policy direction on Chinese chemicals.
Neutral Reference Points for International Buyers
- Timing: Between 1 August and 7 September 2026, the main Chinese market reference price rose about 16% in total (CNY 9,617 → CNY 11,183/tonne). This is a cost-event rebound; the risk of chasing is higher than the risk of waiting for a pullback and buying in tranches. Geopolitical premiums historically arrive quickly and leave just as fast — the two peaks-and-retracements of March and August are recent precedents.
- Multi-source comparison: Supply capability on the mainland versus Taiwan/Korea is shifting, and spot sources in Southeast Asia are multiplying; standardize the CFR/FOB basis when soliciting quotes and cross-validate against at least two or three offers.
- Grade matching beats price comparison: Competition is fierce on general-purpose grades, but spreads for flame-retardant, heat-resistant, transparent and plating grades are protected by technical and certification barriers and remain relatively stable. Buyers should work backward from end-product certification requirements (e.g., UL, RoHS, REACH, food-contact regulations) to lock in a grade, rather than comparing against an “average ABS price.”
- Compliance lead time: The EU Packaging and Packaging Waste Regulation (PPWR) entered into application on 12 August 2026, repealing the earlier packaging directive; recycled-content targets for plastic packaging follow from 2030. Supply chains involving recycled content and certification systems should be planned well in advance (the exact polymer scope should be checked against the official implementing texts).